Madeo synthesis
Debug oriented HLS
Red Pill Environment
Biniou embeds a CABA (Cycle Accurate Bit Accurate) simulator.
Design validation
Software or design validation mainly covers two activities: testing and debugging. Testing refers to the error detection, as an example using characterization tests, while debugging is the task of tracking the causes of a failure. This carries the obvious need for strong observability and controllability but also abstract analysis and fast changes :
- Observability ensures the designer knows what is going on.
- Controllability is the ability to control the execution flow.
- Abstract analysis speeds up understanding by focusing on key aspects.
- Changes are required to fix some deviations.
Debugging means identifying and understanding the deviations, to allow fixing their consequences by invalidating their cause. Hence, debugging is in kind a very iterative process looping over hypothesis-experiment-conclusion cycles.
Software view
As software agile programming promotes a just-fit approach, debugging has come to be a key piece of the software designer toolbox. Because any evolution may cause a regression, and because only the debugger can provide a significant insight, even component based/platform based development makes a massive use of the debugging environment.
Software debugging happens through multiple back and forward navigation steps into the stack of contexts/current state.
A common practice consists in scrolling down back in the history stack, assigning a value to a variable, then going back to the future looking forward to observing the impact of changes over the execution.
Hardware view
On the opposite, when designing an hardware product, the main design scheme conforms to waterfall, with early decisions that shall be revised as little as possible. Out of dynamic languages world, debugging is definitively not a mainstream way of development, but a stage that designers suffer.
This comes from extremely long cycles time compared to software, with specific issues in testing, as operating testing at speed often requires to test in situ.
Time has now come for EDA tool suite to offer advanced debugging functionality to preserve the reconfigurable architectures time-to-market benefit. This happened 20 to 30 years ago for software engineering, when software designers shifted from assembly code hand writing to compilers and comprehensive debuggers use.
Debuging
Debugging is in kind a very iterative process looping over hypothesis-experiment-conclusion cycles.
Be it software or hardware oriented, debugging relies on probes to provide a way to check the state of the system at a specific point.
When validating software, a probe does not change the source code design, but will affect the timing of the program execution. Similarly, using an electronic probe does not change the design of an electronic circuit but, when used, it may change the circuit's characteristics slightly.
There are two basic types: breakpoint, which interrupts processing, and watchpoint, which logs status information without disturbing the execution.
Software controlability and observability
During software execution, a breakpoint immediately opens the system debugger when triggered. It shows the last several functions executed and the top function in the stack is the function containing the breakpoint.
The debugger tool allows for extensive exploration of the history of execution flow, for modifying variable values or code on the fly, and for controlling program execution. After a breakpoint has triggered a function can be continued, executed step by step with or without diving into functions call.
Hardware observability
When debugging an FPGA, designers can use embedded logic analyzers or connect some IOs to a mixed-signal oscilloscope (MSO).
The logic analyzes offer an insight to understand the bahavior of the FPGA, in the context of the surrounding system.
This goes through connecting some internal signals to physical pins, only a small number of which are commonly available. In addition to this limitation, routing additional nets can affect the overall performances of the circuit and pushes more pressure on the P&R tools. Agilent Technologies however provides a software solution that overcomes some of these limitations by offering dynamic probes.
Another solution lies in bitstream instrumentation. Xilinx ATC2 cores can be added either during the design stage of within a post-synthesized netlist, to offer access to any internal signal and communication with external MSO. ChipScope is another solution to reflect activity after signals capture.
Also some FPGAs offer read back capability, and internal signals can be retraced. This was initiated with the fastmap interface of Xilinx 6200 and ICAP/JTAG are now widely used to write signals and read back results.
These several solutions brought the observability designers missed for years in reflecting the FPGA internal state. Although, these functionalities remain available at a very low-level, compared to functional specification.
An obvious need for controlability
Debugging requires more than observability. Some timing windows are crirical as there happen the critical operations (inter process synchronization, looping, conditions, etc) while digging into some other should be avoided to prevent over consumption of logging resources.
Here lies the need for controlability. Controlability enables to discretize time and to isolate hot-time windows, hence all the designer needs is to focus on these windows.
The
obvervability policy can then be tuned up depending on the window tag so
that only hotspots are considered with care.
Therefore, what matters is combining software debugging flexibility with hardware execution performances, and no other solution that in-situ and at-speed execution raises up.
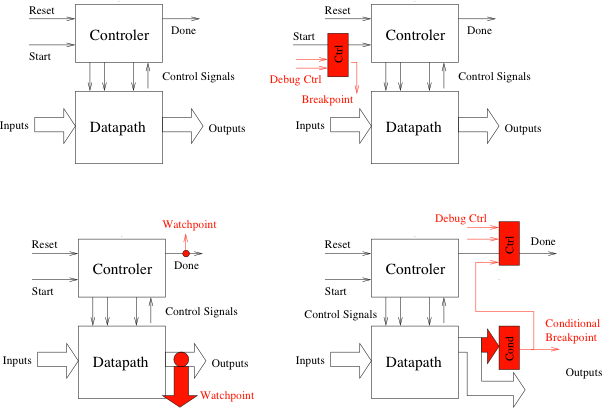
Our approach ensures hardware performances while carrying controllability by controller insertion (figure above), and then supports focusing on some hot windows, rather than paying the cost of a full and useless observability.
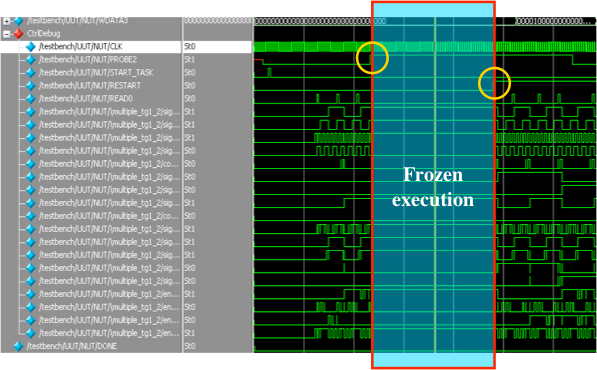
The figure below illustrates a “bullet time” effect under the control of probe based handler. This window allows state extraction (observability) before the designer resumes the execution.
Embedding these functionalities in an HLS environment offer a fast path to validation as well as replacement solution for virtualization or co-design.
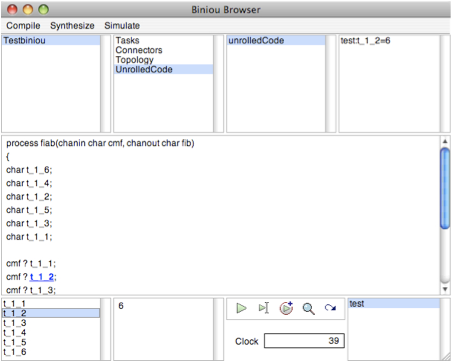
The Red-Pill environment (above figure) makes use of C code describing functions to be accelerated and XML code for process topology and data organization, then generates an unrolled code on which the designer can set breakpoints to be further (in)validated and (re)programmed. As soon as one condition arises, the execution stops, high level variables are rebuilt from signals. The clock cycle and the active conditions are shown.